Navigating Market Risk with Artificial Intelligence


6 Minute Read
Summary
Qraft Technologies’ AI Risk Indicator is a tool for investors seeking to navigate volatile markets.
The AI Risk Indicator predicts market risk for the coming week using an easy-to-interpret scoring methodology ranging from 1 to 100.
In a backtest dating to 1999, a hypothetical portfolio of U.S. Large Cap Equities and cash following the AI Risk Indicator methodology produced an annualized return of 5.64%, while a portfolio of 100% U.S. Large Cap Equities returned just 4.57% (excluding transaction costs and fees).
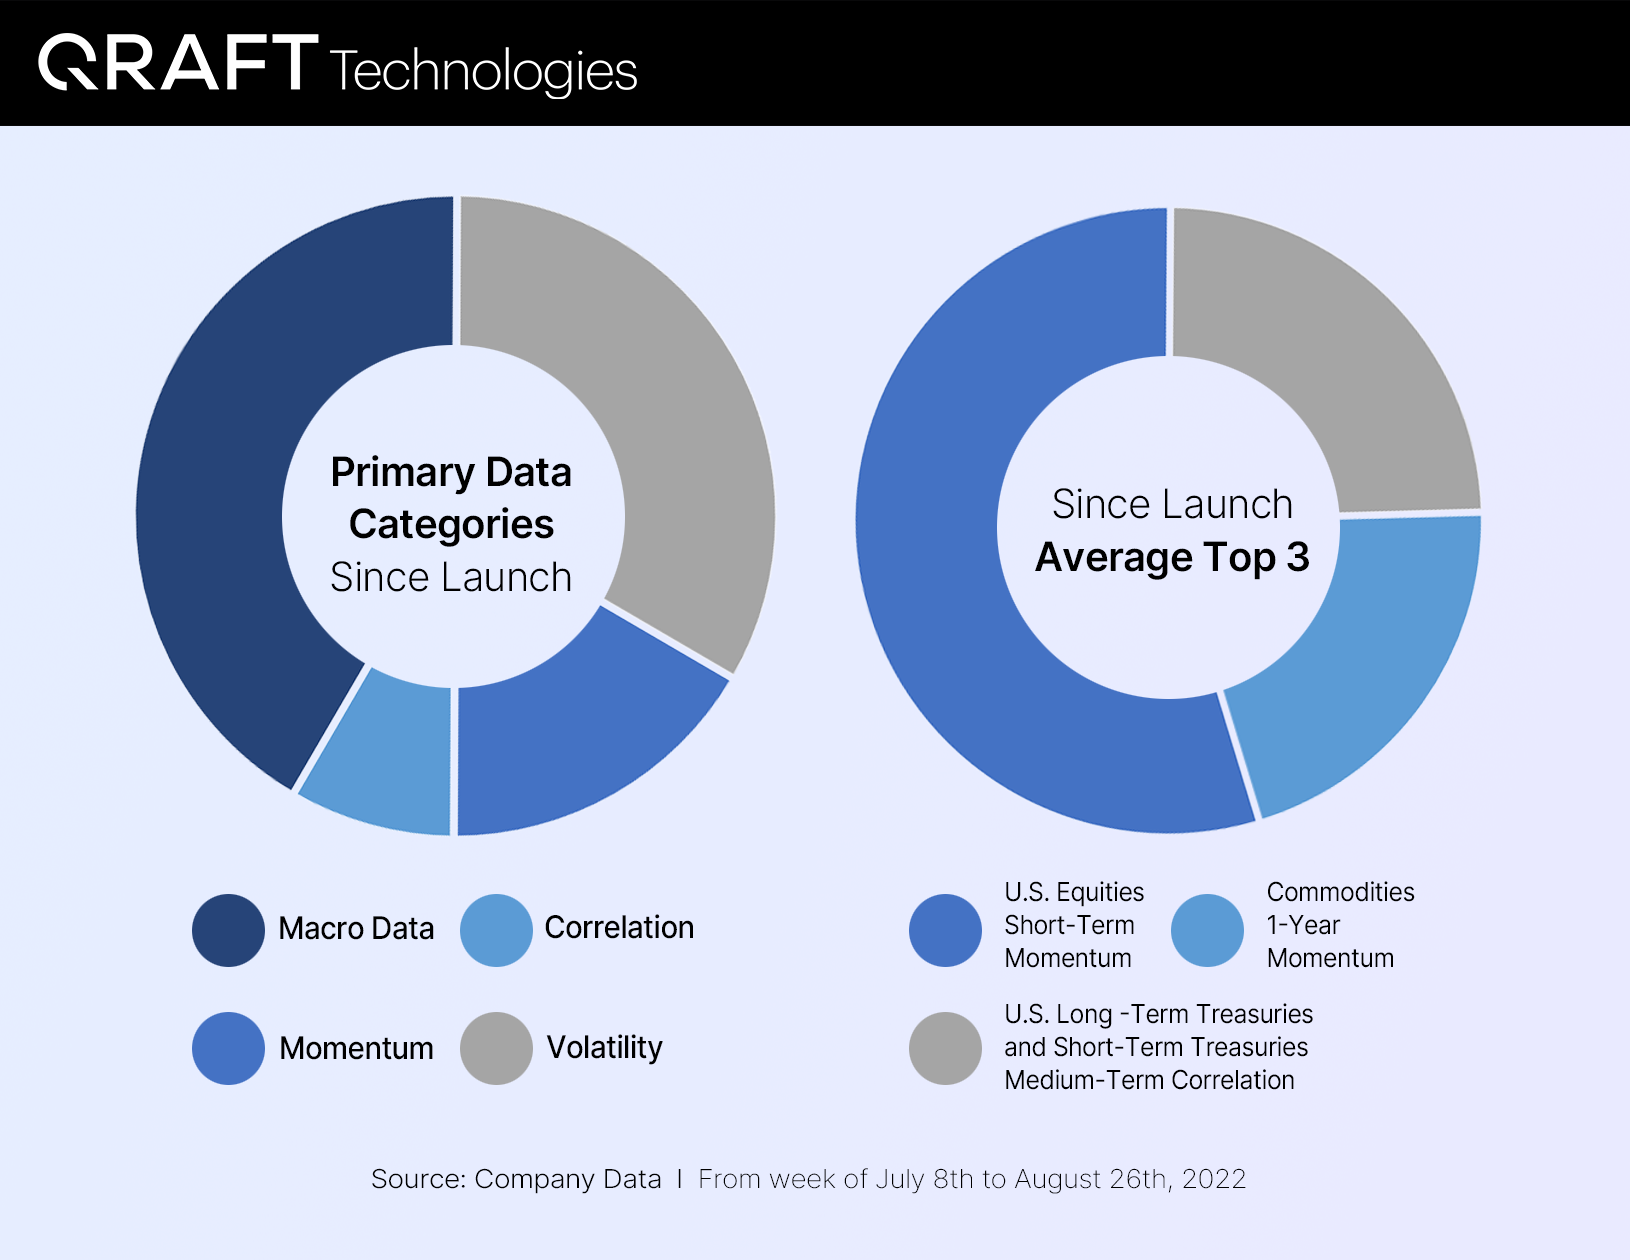
Since July 1, of the 70 features (data inputs) in the model, macro-economic data and volatility metrics were the most prevalent features influencing the Risk Indicator score, while short-term equity momentum had the highest average weight among all features over that timeframe.
2022 continues to be a challenging time for investors, with volatile markets compounded by the macro-economic outlook, inflationary pressures, predictions of the Federal Reserve’s rate stance…the list goes on. Safe haven assets like fixed income have also suffered, leaving very few places for investors to hide in this downturn. However, a rally in late July and early August has offered some hope for H2, even though debates continue whether this is the bottom or a bear market bounce. While no one, including Artificial Intelligence (AI), knows the answer to that question, AI can help assess key data points to try and predict market risk.
Qraft Technologies is on a mission to transform investment decision making by applying AI technology. While choosing the right stocks is important, managing risk is equally as important. To help investors navigate volatile markets and manage near-term portfolio risk, we developed the Qraft AI Risk Indicator. The Qraft AI Risk Indicator applies our proprietary AI techniques to predict market risk for the coming week using an easy-to-interpret scoring methodology of 1 to 100. Following extensive backtesting, we launched the tool in July of this year and since its launch, the model has shown to be a powerful and timely tool, particularly given the volatile markets we are experiencing lately.
The Qraft AI Risk Indicator
Momentum. Volatility. Correlation. These three metrics give us insight into market movements and where markets may be heading. However, the volume of data inputs in macroeconomic assessment is enormous. While it is easier to assess macro data in hindsight, it is a challenge for humans alone to effectively assess massive data sets in real time. This is where Artificial Intelligence can help.
Qraft’s AI Risk Indicator is a machine learning model that takes in over 70 different macro inputs in nearly real time to assess current momentum, volatility, and correlation metrics. Our model has learned and trained on data back to 1999 and our extensive backtests indicate this is a tool that can help investors navigate risk in markets when the risks are not so easy to anticipate.
How the Qraft AI Risk Indicator helps investors
There are two ways investors can use Qraft’s AI Risk indicator. First, as a general indicator of market risk. The model has been categorized into three levels, Risk On, Cautious, and Risk Off, based on where the number that the model provides falls into. The second is as a tool to help in asset allocation decisions between cash and equity positions. The score provided by the Risk Indicator is the model’s suggested cash allocation.
Since its launch, the AI Risk Indicator has had scores ranging from 1 to 52, showing that the markets have changed quickly – and that the model has adapted rapidly as well. In the first week of the launch, the indicator was risk-off, then Cautious, and then risk-on for seven weeks before returning to Cautious in the week of August 22. A hypothetical portfolio comprised of U.S. Large Cap Equities, that used the weekly score to align with the cash position in the portfolio, would have returned 4.99% over the last six weeks, versus 3.90% for a portfolio invested in U.S. Large Cap Equities alone (excluding transaction costs and fees).
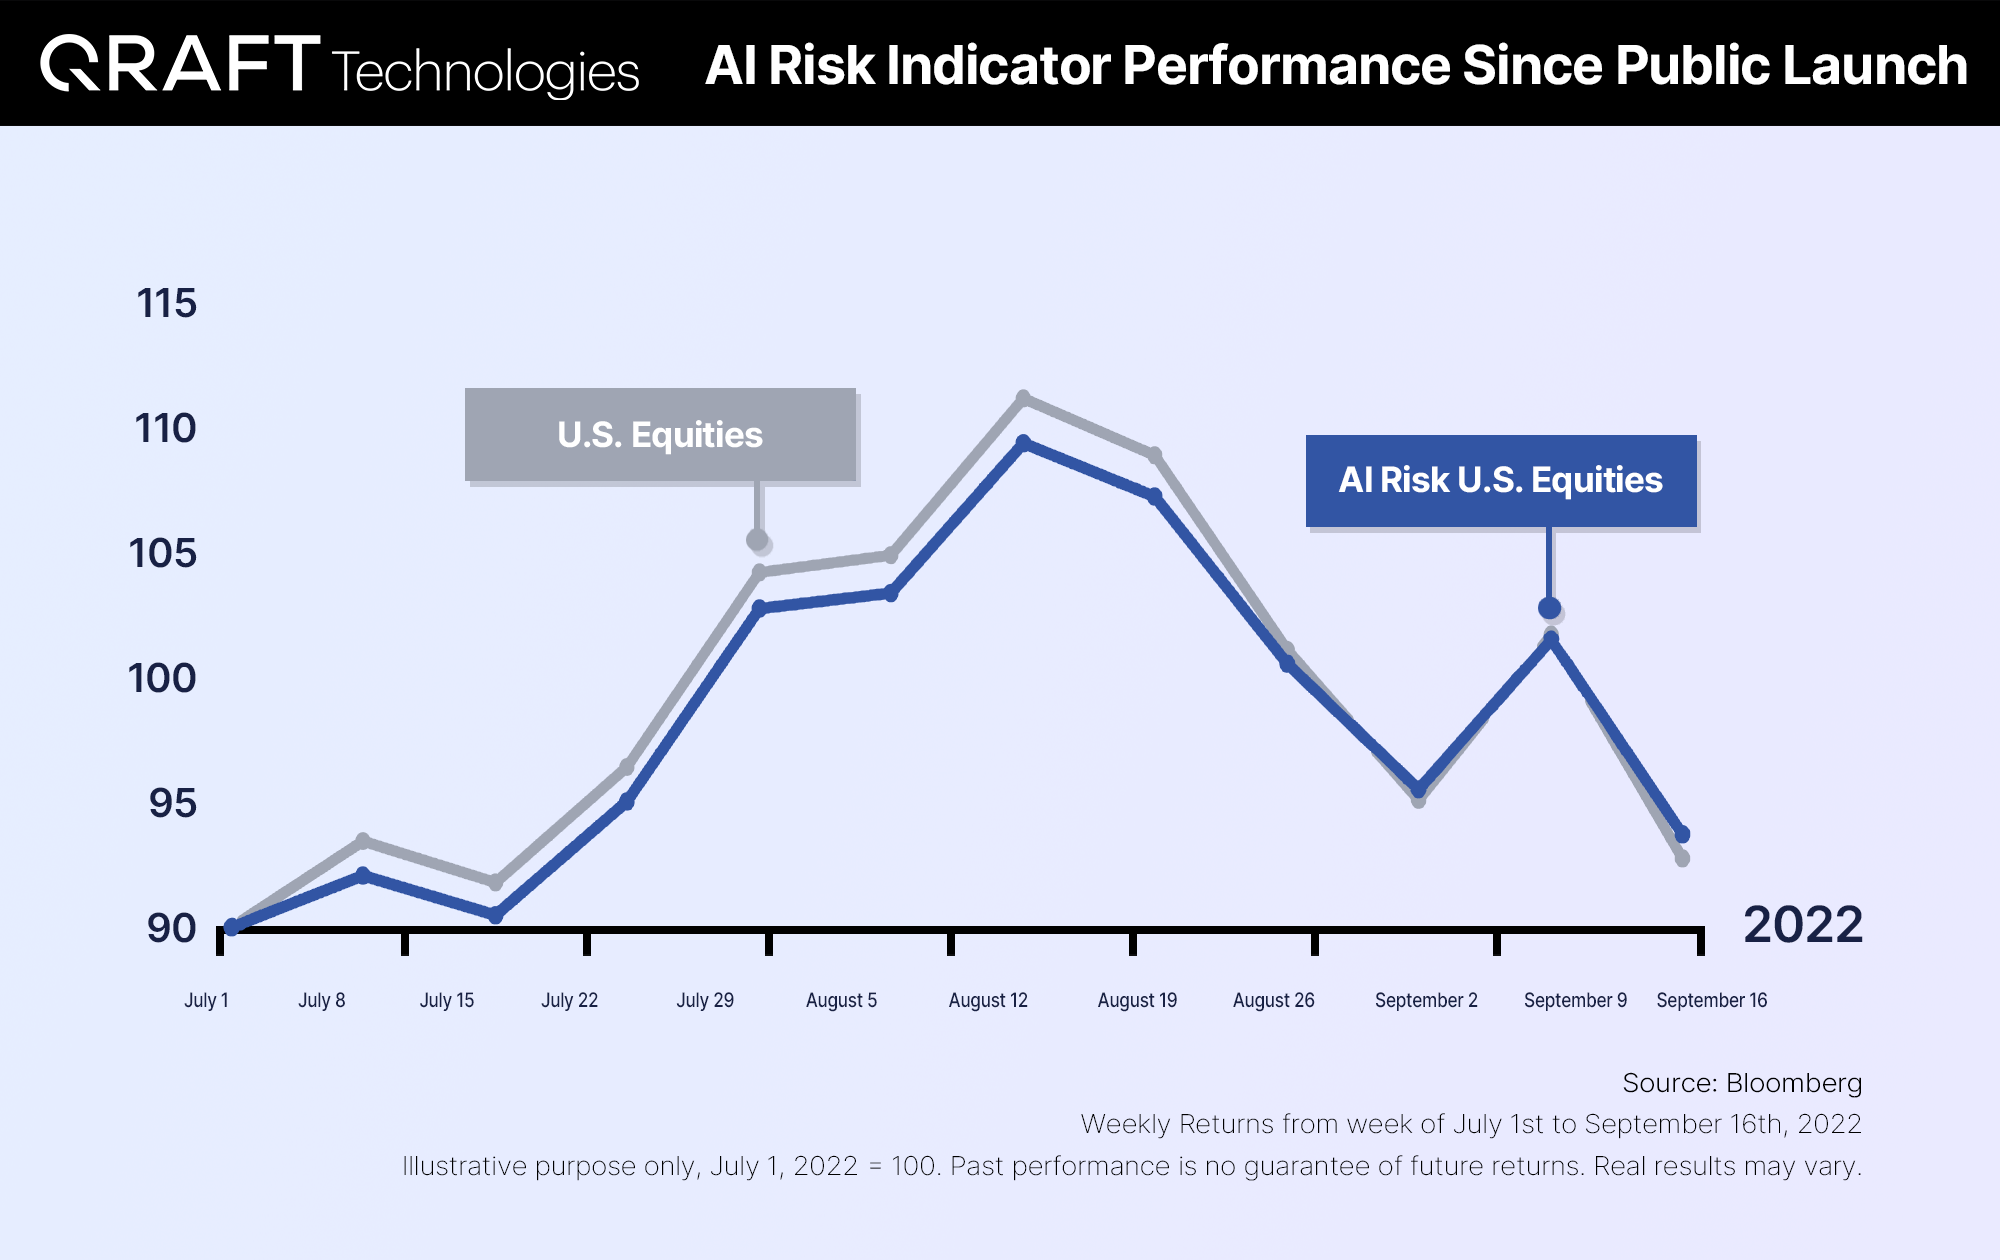
Zooming out and looking at the hypothetical performance since the model’s inception in 1999, we see the portfolio comprised of U.S. Large Cap Equities that used the weekly score to align with the cash position in the portfolio would have returned 5.64% (annualized), versus 4.57% (annualized) for a portfolio invested in U.S. Large Cap Equities alone (excluding transaction costs and fees).

Past performance is no guarantee of future returns. Real results may vary. Hypothetical, backtested performance results have inherent limitations. Hypothetical returns are calculated based on the application of a backtested model. Past hypothetical backtest results are neither an indicator nor a guarantee of future returns. Actual results will vary from the analysis. Past performance should not be taken as an indication or guarantee of future performance, and no representation or warranty, expressed or implied is made regarding future performance.

Inside the Risk Indicator - AI Insights
Beyond the performance, we can also track which features, or data inputs, were the most important to the model’s output. Since the AI Risk Indicator’s official launch on July 1, 15 different features were in the top 3:
Different Features in the Top 3 for Last 6 Weeks
Commodities 1-Year Volatility
U.S. Equities Short-Term Momentum
U.S. Long-Term Treasuries and Short-Term Treasuries Medium-Term Correlation
U.S. Short-Term Treasuries 1-Year Volatility
U.S. Short-Term Treasuries Medium-Term Volatility
Personal Consumption Expenditures
S&P/Case-Shiller U.S. National Home Price Index
Commodities Short-Term Volatility
Commodities 1-Year Momentum
U.S. Short-Term Treasuries 1-Year Momentum
Effective Federal Fund Rate
Total Business: Inventories to Sales Ratio
U.S. Long-Term Treasuries Bond 1-Year Volatility
U.S. Equities 1-Year Volatility
U.S. Long-Term Treasuries Bond Short-Term Volatility
Source: Company Data
From the week of July 8th to August 26th, 2022
As the model takes in features from three different calculations (Momentum, Volatility, and Correlation) as well as macro data, we can see the distribution of categories during that time. In addition, when averaging the weights of all the features, we can see the top three features by average weight, with U.S. Equities short-term momentum being the top feature since the launch.
While no one can predict the future, Artificial Intelligence can be a helpful tool for investors in making timely investment decisions in rapidly moving markets. By processing large amounts of data, AI is not only able to find patterns that we may miss as humans, but it can also help us overcome our greatest enemy in investing, our emotions and bias.
To follow the AI Risk Indicator’s weekly update, click here.
This material has been prepared by Qraft Technologies, Inc. This material is intended for the exclusive use of the person to whom it has been delivered by Qraft Technologies, Inc.
This material does not constitute an offer to sell or the solicitation of an offer to buy any security or to enter into any agreement and Qraft Technologies, Inc. is not soliciting any action based upon this material.
The material is based upon information that we consider reliable, but we do not represent that it is accurate or complete, and it should not be relied upon as such. Consequently, we accept no responsibility or liability for the accuracy or otherwise of such information.
Opinions expressed are our current opinions only, any historical prices or values are as of the date indicated, and we accept no responsibility to update any of the information contained in this material.
No part of this material may be (i)copied, photocopied, or duplicated in any form, by any means, or (ii)redistributed without Qraft Technologies, Inc.’s prior written consent.
You should not rely on any of the information contained herein and you must obtain your own independent investment, financial, strategic, legal, regulatory, accounting and tax advice from your professional advisors.
Further information on any of the contents mentioned in this material may be obtained upon request, and for this purpose should contact Qraft Technologies, Inc.
Copyright 2022 Qraft Technologies, Inc. All rights reserved. Qraft Technologies, Inc. prohibits the redistribution of this material and accepts no liability whatsoever for the actions of third parties in this respect.
All communications and inquiries relating to this document and a possible transaction or partnership should be directed solely to Qraft Technologies, Inc.
Related Articles


